
If you own a business doing somewhere between $1 million and $30 million in revenue and you have asked three different people what it is worth, you have probably heard three very different answers. That is not because anyone is wrong. It is because your business likely sits near the line that separates two completely different valuation worlds: the Main Street market and the Lower Middle Market.
The two tiers do not just produce different numbers. They use different earnings metrics, attract different buyers, and apply different multiples. Use the wrong tier’s rule of thumb and you can mis-price your company by a turn of earnings or more. This guide explains which tier you are in, why the math changes with size, and what current 2024 to 2026 deal data actually shows.
TL;DR: Main Street businesses (up to about $5 million in revenue and under roughly $2 million in EBITDA) are valued on a multiple of Seller’s Discretionary Earnings (SDE) and bought mostly by individuals using SBA loans. Lower Middle Market companies (roughly $5 million to $150 million in revenue, with more than $2 million in EBITDA) are valued on a multiple of recast EBITDA and bought by private equity and strategic acquirers. Bigger companies earn higher multiples because they carry less risk, a pattern the data calls the size effect.
I am Joel Duran, and I have spent 15 years advising owners across the Gulf South on what their businesses are worth and how to sell them. Most of the valuation confusion I see does not come from owners being careless. It comes from honest people reading a headline multiple meant for a different size of company and applying it to their own.
A contractor doing $1.5 million in revenue and a manufacturer doing $18 million both deserve a real answer, but they live in different markets with different buyers and different math. The examples in this article are composites drawn from that experience, not any specific client. The goal here is simple: help you find your tier, understand the metric that applies to it, and avoid the most expensive mistakes I watch owners make.
Key Takeaways
– Main Street uses SDE multiples; the Lower Middle Market uses EBITDA multiples. Duran defines Main Street as up to about $5 million in revenue and $2 million in EBITDA, and the Lower Middle Market as $5 million to $150 million in revenue with more than $2 million in EBITDA. (Deal databases quote multiples on SDE under about $2 million in deal value and on EBITDA above it, an IBBA & M&A Source convention.)
– Main Street businesses sold at a median of about 2.6x SDE in 2025 (BizBuySell, 2025), while lower-middle-market companies averaged about 7.5x EBITDA in Q3 2025 (GF Data, 2025).
– The same dollar of earnings is worth more inside a bigger company. This size effect is documented across every major deal database.
– Buyer type changes with tier: individuals and SBA borrowers on Main Street, private equity and strategic acquirers in the Lower Middle Market.
– The most common valuation error is applying a Lower Middle Market EBITDA multiple to a Main Street business, or the reverse, and arriving at a price the market will never pay.
Main Street vs. Lower Middle Market: what is the difference?
The difference is size, and size changes almost everything else. Main Street generally means smaller, owner-operated businesses with up to about $5 million in revenue and under roughly $2 million in EBITDA. The Lower Middle Market covers companies with roughly $5 million to $150 million in revenue and more than $2 million in EBITDA. As size rises, the valuation metric and the buyer pool change with it.
Definitions vary by source. Duran draws the line by revenue and earnings: Main Street runs up to about $5 million in revenue and $2 million in EBITDA, and the Lower Middle Market spans roughly $5 million to $150 million in revenue with more than $2 million in EBITDA. A related convention appears in the deal databases: the IBBA and M&A Source Market Pulse survey quotes deals under $2 million in value as multiples of SDE, and deals from $2 million to $50 million as multiples of EBITDA. That data convention reflects how buyers and their lenders actually behave once a company is large enough to support professional management and institutional capital.
As a company grows from one tier to the next, three things shift at once: the earnings metric (SDE to EBITDA), the buyer pool (individuals to institutions), and the multiple (lower to higher). The rest of this article walks through each shift, because understanding all three is what keeps you from mis-valuing your company. For the full framework, see the complete owner’s guide to valuation.
Citation capsule: Duran defines Main Street as up to about $5 million in revenue and $2 million in EBITDA, and the Lower Middle Market as $5 million to $150 million in revenue with more than $2 million in EBITDA. In the deal databases, businesses under $2 million in value are quoted on a multiple of Seller’s Discretionary Earnings (SDE) and those from $2 million to $50 million on a multiple of EBITDA (IBBA and M&A Source, Market Pulse, 2025).
How Main Street businesses are valued
Main Street businesses are valued on a multiple of Seller’s Discretionary Earnings (SDE), the total financial benefit a single owner-operator takes from the business. SDE starts with net profit and adds back the owner’s salary, owner perks, interest, taxes, depreciation, and one-time expenses. In 2025, the median Main Street business sold for about 2.6 times SDE on a median sale price near $350,000 (BizBuySell, 2025).
The logic of SDE is that a Main Street buyer is usually buying a job plus a return. That buyer will run the business day to day, so the salary a previous owner paid themselves is part of the earnings the new owner gets to keep. According to BizBuySell’s full-year 2025 data, closed Main Street transactions had a median revenue of about $703,000, median cash flow (SDE) of roughly $159,000, and sold at an average of about 2.6x SDE and 0.69x revenue.
The buyer on Main Street is typically an individual: a first-time owner, a corporate refugee, or a local operator expanding. Financing usually runs through an SBA 7(a) loan, which is why deals tend to cluster under the bank-friendly size where an SBA guarantee and a personal guarantee can carry the purchase. That financing reality is a big reason Main Street multiples stay compressed. The pool of buyers is large but their access to capital is limited, and a business that depends heavily on the owner is riskier to a lender. If you want a fast read on where you might land, try the 10-minute self-assessment of what your business is worth.
Citation capsule: In 2025, the median Main Street business sold at about 2.6x Seller’s Discretionary Earnings on roughly 0.69x revenue, with a median sale price near $350,000 and median SDE of about $159,000 (BizBuySell, 2025 Year-in-Review).
How Lower Middle Market businesses are valued
Lower Middle Market companies are valued on a multiple of EBITDA (earnings before interest, taxes, depreciation, and amortization), after the financials are recast to a normalized, market-rate basis. In Q3 2025, the average lower-middle-market transaction closed at about 7.5 times trailing-twelve-month adjusted EBITDA (GF Data, 2025), up from 6.9x the prior quarter. That is roughly three turns of earnings above the typical Main Street SDE multiple.
The key word is recast. Where SDE adds the owner’s full compensation back in, EBITDA assumes the company will be run by hired management, so it subtracts a market-rate salary for whoever replaces the owner. A sophisticated buyer normalizes one-time costs, above-market or below-market rent, discretionary spending, and non-operating items to arrive at a clean, repeatable earnings number. This is why proper recasting of financial statements can move a valuation more than almost anything else an owner does before a sale.
The buyers are different too. Lower Middle Market acquirers are usually private equity firms, search funds, family offices, or strategic acquirers buying for synergy or market share. They use professional diligence, committed capital, and often leverage. Because these buyers can deploy debt against a company that runs without its founder, they will pay more for the same dollar of earnings than an individual SBA borrower can. That is the engine behind the higher multiples in this tier, and it is why the buyer mix matters as much as the metric.
Citation capsule: Lower-middle-market companies are valued on recast EBITDA and averaged about 7.5x trailing-twelve-month adjusted EBITDA in Q3 2025, up from 6.9x the prior quarter, driven by private equity and strategic buyers with access to leverage (GF Data, 2025).
SDE vs. EBITDA: why the earnings metric changes with size
The metric changes because the buyer’s relationship to the business changes. SDE measures the total benefit to one working owner and is used for smaller companies a single person will operate. EBITDA measures the profit a company produces independent of any one owner’s labor and is used for larger companies run by hired management. The dividing question is simple: will the buyer work in the business, or own it?
Consider a composite example. A specialty service business earns $900,000 in SDE, which includes a $250,000 owner salary plus add-backs. On Main Street, at roughly 2.6x to 3.0x SDE, that implies a value in the neighborhood of $2.3 million to $2.7 million. Now imagine the same business is large enough that a buyer must hire a $200,000 general manager to replace the owner. The EBITDA becomes about $700,000 after that market-rate salary. At a lower-middle-market multiple of, say, 5x EBITDA, that is roughly $3.5 million.
Same business, two legitimate methods, two different numbers, because the buyer pool and the operating assumption differ. The trap is converting between the two carelessly. You cannot take an SDE figure and multiply it by an EBITDA multiple, or vice versa. The earnings base and the multiple are a matched pair. For a deeper walk-through of the methods, see how to value a business.
Why bigger businesses earn higher multiples (the size effect)
Bigger businesses earn higher multiples because they carry less risk, a pattern valuation professionals call the size effect or size premium. Larger companies usually have professional management, diversified customers, documented systems, and earnings that survive the owner’s departure. Buyers and lenders price that lower risk as a higher multiple, so each dollar of earnings is simply worth more inside a bigger company.
The drivers are concrete. A $400,000-SDE business often depends on the owner for sales, relationships, and quality control, which makes it fragile and hard to finance. A $4 million-EBITDA business typically has a management layer, so it is more transferable and can support acquisition debt. It also tends to have customer concentration low enough that losing one account is survivable. Each of those traits removes risk, and removed risk shows up as multiple expansion.
The chart below shows the pattern using the IBBA and M&A Source Market Pulse median multiples by deal size. Note that the smallest bands are quoted in SDE and the larger bands in EBITDA, consistent with the $2 million crossover.
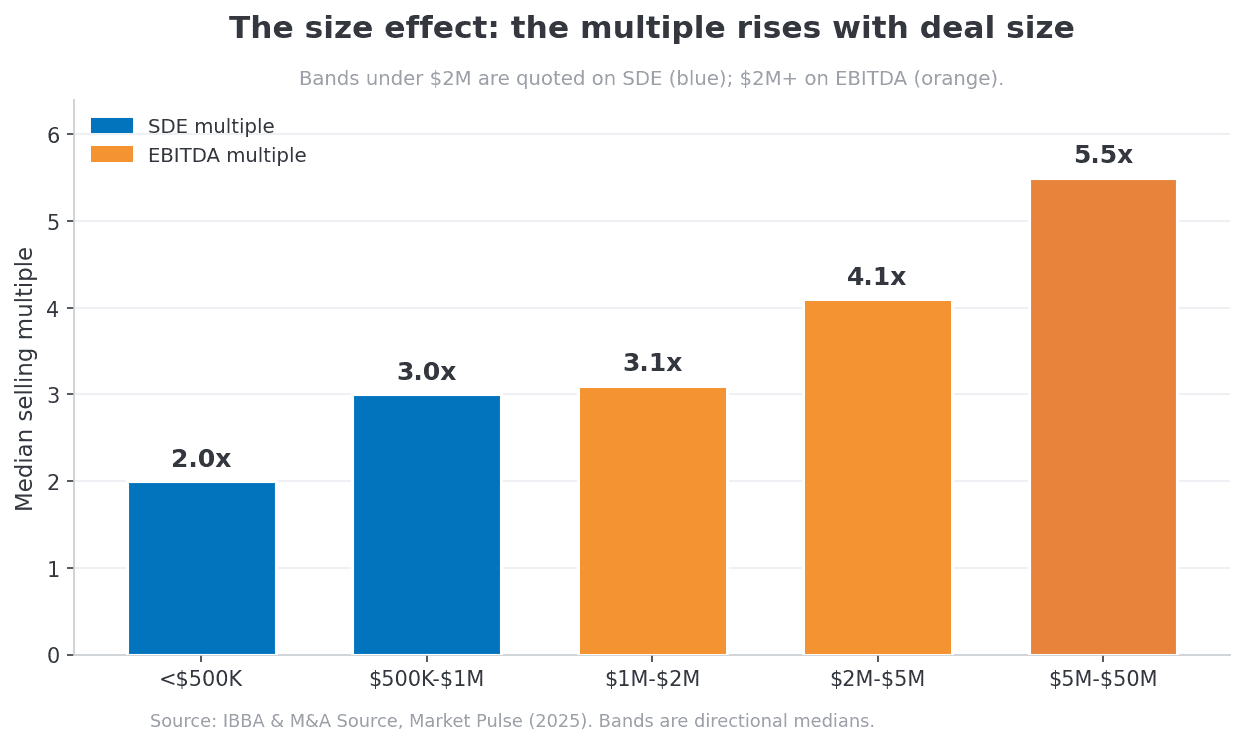
Citation capsule: Median selling multiples rise steadily with deal size, from about 2.0x for businesses under $500,000 to about 5.5x for deals between $5 million and $50 million, reflecting the lower risk and greater transferability of larger companies (IBBA and M&A Source, Market Pulse, 2025).
2026 multiple benchmarks by tier
Across the major deal databases, the pattern is consistent: Main Street trades in the low single digits on SDE, and the Lower Middle Market trades in the mid-to-high single digits on EBITDA, climbing into double digits for the largest companies. The table below summarizes current 2024 to 2026 figures from Tier-1 sources. Treat every figure as a market median or average, not a guarantee for your specific business.
| Tier | Typical size | Earnings metric | Recent multiple | Source (year) |
|---|---|---|---|---|
| Main Street | Up to ~$5M revenue; under ~$2M EBITDA | SDE | ~2.6x (median, all sectors) | BizBuySell (2025) |
| Main Street / crossover | <$500K to $2M deal value | SDE | ~2.0x to ~3.1x | IBBA & M&A Source (2025) |
| Lower Middle Market (entry) | $2M-$5M deal value | EBITDA | ~4.1x | IBBA & M&A Source (2025) |
| Lower Middle Market | $5M-$50M deal value | EBITDA | ~5.5x | IBBA & M&A Source (2025) |
| Lower Middle Market (overall avg) | $10M-$500M TEV | EBITDA | ~7.5x (Q3 2025 avg) | GF Data (2025) |
| Private companies (all) | Mixed | EBITDA | ~3.5x (Q4 2025 median) | DealStats / BVR (2025) |
A few notes on reading the table. The DealStats median of about 3.5x is lower than GF Data’s 7.5x because DealStats includes a large volume of very small Main Street deals that pull the median down, while GF Data tracks only completed lower-middle-market transactions from $10 million to $500 million. Both are correct; they measure different populations. As BVR puts it, generally the greater the transaction enterprise value, the greater the multiple.
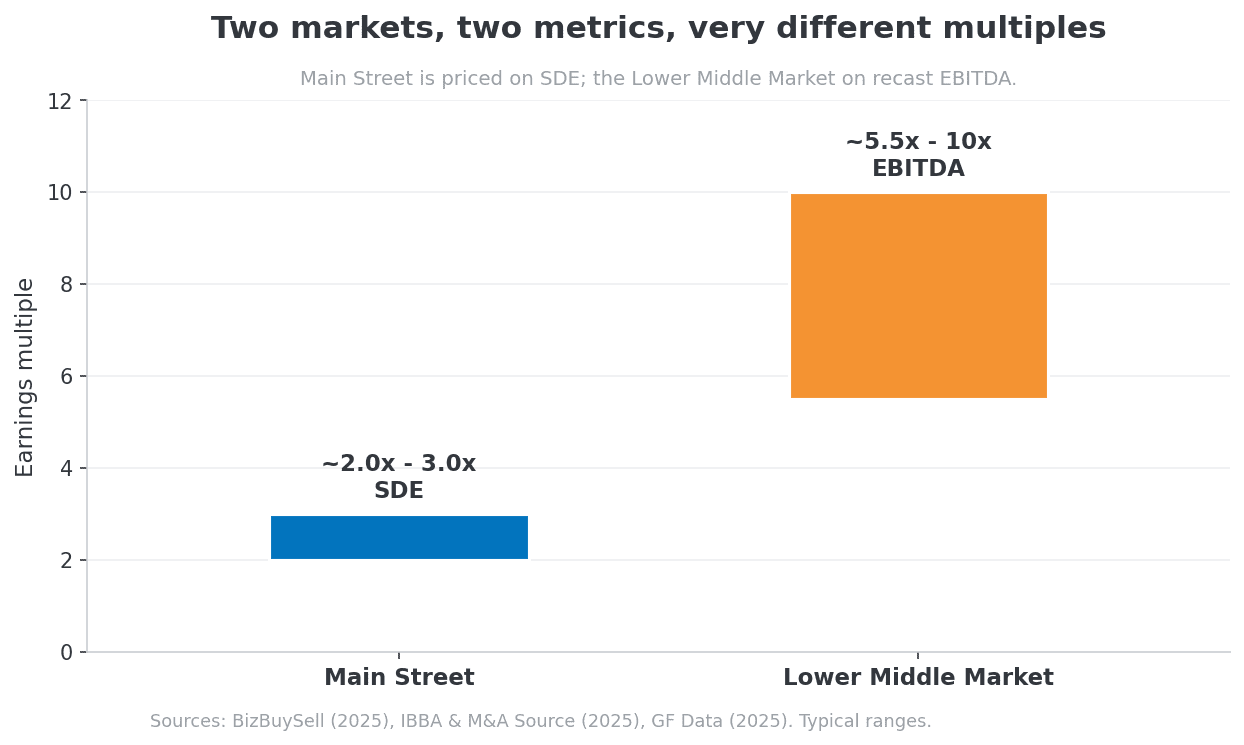
Within the Lower Middle Market itself, the size premium keeps climbing. GF Data’s reporting indicates that the smallest tracked deals (roughly $10 million to $25 million in enterprise value) average in the low-to-mid 6x range, while companies above $100 million in enterprise value reached roughly 10x in 2025. The chart below compares the typical Main Street SDE range against the Lower Middle Market EBITDA range to make the gap concrete.
Citation capsule: Private-company selling multiples vary by the population measured: DealStats reported a median of about 3.5x EBITDA across all private deals in Q4 2025, while GF Data, which tracks only $10 million to $500 million transactions, averaged about 7.5x EBITDA, because larger deals carry higher multiples (DealStats/BVR, 2025; GF Data, 2025).
Which approach applies to your business?
If your business has up to about $5 million in revenue and under roughly $2 million in EBITDA, and would most likely be bought and operated by an individual, you are a Main Street business and should be valued on an SDE multiple. If it runs from about $5 million to $150 million in revenue with more than $2 million in EBITDA after a market-rate manager’s salary and could run without you, you are in the Lower Middle Market and should be valued on an EBITDA multiple. The companies near the $2 million EBITDA line are the gray zone, and that is where it matters most.
Businesses right at the boundary can often be positioned either way, and the framing changes the value. A company near $2 million in EBITDA might be sold as a strong Main Street business at an SDE multiple, or repositioned as an entry-level lower-middle-market platform at an EBITDA multiple to a private equity buyer building a roll-up. The same financials, marketed to the right buyer pool with the right metric, can land in a meaningfully higher range. This is precisely where advisory judgment earns its keep.
Getting the tier right is not academic. It determines which buyers you market to, which lender programs apply, how you present the financials, and what a realistic asking price looks like. Our valuations practice focuses on lower-middle-market and crossover companies across the Gulf South, where local market knowledge and the right buyer network often move the number more than the multiple itself. With a structured process, you will know what the market thinks in under 30 days.
Common valuation mistakes when owners use the wrong tier’s math
The most expensive valuation mistakes nearly all come from one root error: applying the wrong tier’s rule of thumb. Owners read a multiple meant for a different size of company, attach it to the wrong earnings base, and arrive at a number the market will never pay (in either direction). Here are the patterns I see most often, with the fix for each.
Mistake 1: Multiplying SDE by an EBITDA multiple. An owner hears that “businesses sell for 6 times EBITDA,” takes their $900,000 SDE figure, and expects $5.4 million. But that 6x is a lower-middle-market EBITDA multiple, and SDE is not EBITDA. The fix is to match the metric to the multiple: SDE pairs with an SDE multiple, EBITDA with an EBITDA multiple.
Mistake 2: Forgetting to subtract a manager’s salary. Moving from Main Street to a Lower Middle Market valuation means a buyer assumes hired management. If you do not deduct a market-rate replacement salary before applying an EBITDA multiple, you overstate earnings and your price collapses in diligence. Sound financial recasting handles this correctly.
Mistake 3: Assuming size alone earns a premium without the substance behind it. The size effect is real, but it reflects lower risk, not just bigger revenue. A larger company that still depends entirely on its owner, or has one customer at 60 percent of sales, will not earn the higher multiple its revenue suggests. Buyers price the risk, not the headline.
Mistake 4: Trusting an online calculator or a competitor’s rumored sale price. Rules of thumb and rumored prices rarely disclose the earnings base, the add-backs, or the deal terms behind the number. A seller-financed earnout at a high headline multiple can be worth less than a clean all-cash deal at a lower one. The fix is a real, recast-based valuation tied to current comparable transactions.
Every industry is different, but some rumors refuse to die. More than once I have heard that a business should be priced on a multiple of revenue instead of its net profit or EBITDA. And in some of the most extreme cases, small Main Street owners have been told their business was worth seven, ten, even more times net profit. When I hear a number like that, I ask one simple question: based on it, a buyer would have to run this company for more than a decade without taking a paycheck before they earned their money back. Does that sound reasonable? I rarely get an answer, and the absurd multiple usually dies right there in the conversation.
What still surprises me is how many owners will trust an online calculator with the single largest investment of their lives. A calculator does not know your add-backs, your owner dependence, or what buyers in your size tier are actually paying. That is why it pays to get your price from an advisor who does two things: sells businesses for a living, and understands the framework a professional valuator uses to value the company. Together, those are what separate a real number from a rumor.
Citation capsule: Mis-pricing usually traces to a metric mismatch: pairing SDE with an EBITDA multiple, or failing to deduct a market-rate manager’s salary when shifting from an SDE basis to an EBITDA basis. The earnings base and the multiple are a matched pair (IBBA and M&A Source convention, 2025).
Frequently Asked Questions
What is the difference between SDE and EBITDA?
SDE (Seller’s Discretionary Earnings) adds the owner’s full salary and perks back into profit, because a Main Street buyer will operate the business themselves. EBITDA subtracts a market-rate salary for hired management, because a Lower Middle Market buyer expects the company to run without the owner. The practical crossover is around $2 million in deal value (IBBA and M&A Source, 2025). Use SDE below that line and EBITDA above it.
What multiple do small businesses sell for in 2025 and 2026?
Main Street businesses sold at a median of about 2.6 times SDE in 2025, on a median sale price near $350,000 (BizBuySell, 2025). Multiples vary widely by industry, profitability, and how dependent the business is on its owner. A clean, transferable business with documented systems commands the higher end of the range, while an owner-dependent one sits below the median.
What EBITDA multiple do lower-middle-market companies sell for?
Lower-middle-market companies averaged about 7.5 times trailing-twelve-month adjusted EBITDA in Q3 2025, up from 6.9x the prior quarter (GF Data, 2025). The multiple rises with size within the tier: deals around $10 million to $25 million in enterprise value run lower, while companies above $100 million reached roughly 10x in 2025. Quality of earnings and customer diversification move the number meaningfully.
Why do bigger companies sell for higher multiples?
Because they carry less risk. Larger companies typically have professional management, diversified customers, and earnings that survive the owner’s exit, which makes them more transferable and easier to finance. Buyers and lenders price that lower risk as a higher multiple. This documented pattern, the size effect, appears across every major deal database, including the IBBA and M&A Source Market Pulse (2025), where multiples rise from about 2.0x for the smallest deals to about 5.5x for the largest.
My business is right at $2 million in EBITDA. Which tier am I in?
You are in the gray zone, and the answer depends on positioning. A company near the $2 million EBITDA line can sometimes be marketed as a premium Main Street business on an SDE multiple, or as an entry-level lower-middle-market platform on an EBITDA multiple to an institutional buyer. The right framing can shift the value range. This is where an advisor who knows both buyer pools adds the most value, because the metric you choose changes who bids and how much.
Can I just use an online valuation calculator?
An online calculator is a useful sanity check, not a valuation. Most calculators apply a generic multiple to a single earnings figure without recasting the financials, accounting for owner dependence, customer concentration, or current comparable deal terms. For a credible number you can defend to a buyer or lender, you need a recast-based valuation tied to recent comparable transactions in your size tier and industry.
Conclusion: find your tier before you trust a number
The reason your business gets valued differently depending on its size is not arbitrary. Main Street and the Lower Middle Market are two distinct markets with different earnings metrics, different buyers, and different multiples. Get the tier right and the math follows. Get it wrong and you will either leave money on the table or chase a price no buyer will meet. The single most important step is matching your earnings base (SDE or EBITDA) to the right multiple for your size, then pressure-testing it against current comparable deals.
If you are somewhere between $1 million and $30 million in revenue and want a clear, honest read on which tier you are in and what your business could realistically command, I am glad to talk it through. You can schedule a valuation conversation at no cost, and you will leave knowing which approach applies to your company and why.
Joel F. Duran has 15+ years of M&A and business brokerage experience and holds the CM&AA, M&AMI, CM&AP, CEPA, CVGA, CVB, CAIM, and CMSBB designations. Duran Advisors serves upper Main Street and lower middle market businesses across the Gulf South, including New Orleans Metro, the North Shore, Baton Rouge, Houma-Thibodaux, and South Mississippi. Examples in this article are composites and do not reference any specific client.
Continue Learning
- Business Valuation: The Complete Owner’s Guide
- What’s My Business Worth: A 10-Minute Self-Assessment
- Recasting Financial Statements: Enhancing Business Valuation
- How to Value a Business
- Duran Advisors Valuations Service
Sources
- BizBuySell, “2025 Year-in-Review / Market Recap,” 2025. https://www.bizbuysell.com/blog/2025-year-in-review/
- IBBA & M&A Source, “Market Pulse Survey, Q3 2025,” 2025. https://www.prnewswire.com/news-releases/the-ibba-and-ma-source-announce-the-results-of-the-market-pulse-q3-2025-survey-302617915.html
- IBBA & M&A Source, “Market Pulse Q3 2025 Highlights” (primary PDF), 2025. https://www.ibba.org/wp-content/uploads/2025/11/market-pulse-highlights-q3-2025.pdf
- IBBA & M&A Source, “Industry Research / Market Pulse” (report hub), 2025. https://www.ibba.org/resource-center/industry-research/
- GF Data, “Middle-Market M&A Slows, Valuation Multiples Rise (Q3 2025),” 2025. https://gfdata.com/gf-data-report-2025-q3-middle-market-ma-slows/
- GF Data, “Small-Deal Resilience, H1 2025,” 2025. https://gfdata.com/small-deal-resilience-h1-2025/
- Business Valuation Resources (BVR), “DealStats Value Index: EBITDA Multiples Ease in Late 2025,” 2025. https://www.bvresources.com/articles/bvwire/dealstats-value-index-ebitda-multiples-ease-in-late-2025
- KMCO, “Private Company M&A Valuation Trends Through Q4 2025” (DealStats data), 2025. https://www.kmco.com/insights/private-company-ma-valuation-trends-through-q4-2025/
- Pepperdine Graziadio Business School, “Private Capital Markets Report, 2025,” 2025. https://digitalcommons.pepperdine.edu/gsbm_pcm_pcmr/18/
- Morgan & Westfield, “What’s a Main Street vs. a Middle-Market Company?” (tier definitions), 2024. https://morganandwestfield.com/knowledge/whats-a-main-street-vs-a-middle-market-company/